今まで、 『nmon』や『Glances』、『saidar』といった監視ツールを紹介してきたが、今回はvmstatライクなコマンド『Collectl』コマンドを紹介する。 このコマンドは、vmstatのように出力した結果を外部ファイルに出力させる事が出来るツールだ。
1.インストール
まずは、以下のコマンドでインストールを行う。
sudo apt-get install collectl # Debian/Ubuntuの場合
sudo yum install collectl # RHEL系の場合
2.コマンドの実行
さて、それでは実際に『Collectl』コマンドを実行してみよう。 まずはヘルプの内容から。
$ collectl -h
defined(@array) is deprecated at /usr/share/collectl/formatit.ph line 3149.
(Maybe you should just omit the defined()?)
This is a subset of the most common switches and even the descriptions are
abbreviated. To see all type 'collectl -x', to get started just type 'collectl'

usage: collectl [switches]
-c, --count count collect this number of samples and exit
-f, --filename file name of directory/file to write to
-i, --interval int collection interval in seconds [default=1]
-o, --options options misc formatting options, --showoptions for all
d|D - include date in output
T - include time in output
z - turn off compression of plot files
-p, --playback file playback results from 'file' (be sure to quote
if wild carded) or the shell might mess it up
-P, --plot generate output in 'plot' format
-s, --subsys subsys specify one or more subsystems [default=cdn]
--verbose display output in verbose format (automatically
selected when brief doesn't make sense)

Various types of help
-h, --help print this text
-v, --version print version
-V, --showdefs print operational defaults
-x, --helpextend extended help, more details descriptions too
-X, --helpall shows all help concatenated together

--showoptions show all the options
--showsubsys show all the subsystems
--showsubopts show all subsystem specific options
--showtopopts show --top options

--showheader show file header that 'would be' generated
--showcolheaders show column headers that 'would be' generated
--showslabaliases for SLUB allocator, show non-root aliases
--showrootslabs same as --showslabaliases but use 'root' names

Copyright 2003-2013 Hewlett-Packard Development Company, L.P.
collectl may be copied only under the terms of either the Artistic License
or the GNU General Public License, which may be found in the source kit
結構、色々な項目を監視出来るようだ。 まずはオプションは何も付けずに実行してみよう。
collectl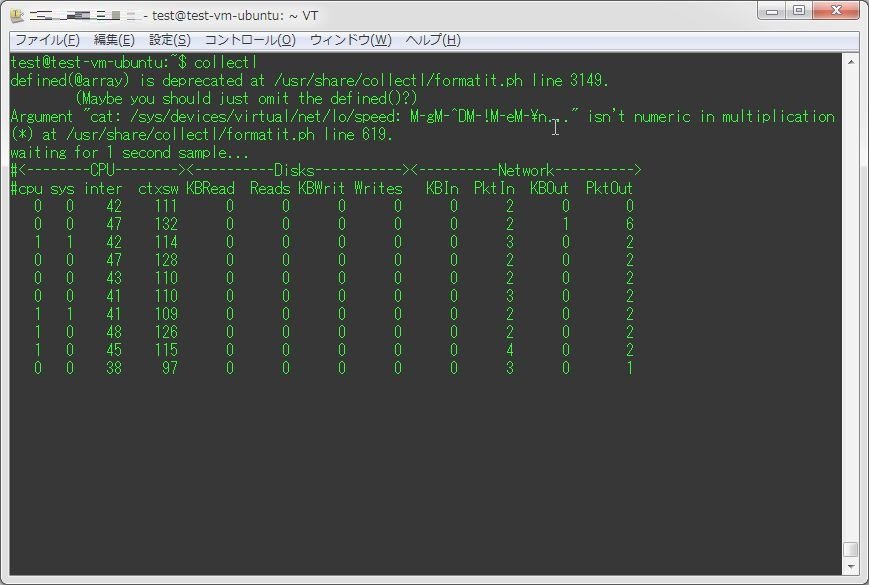
確かにvmstatに似ているね。
その他、オプションを実際に利用する使い方については、以下で記述していく。
CPUの値をモニタリングする
CPUの値は、オプション「-sc」もしくは「-sC」を用いる事で取得出来る。
collectl -sc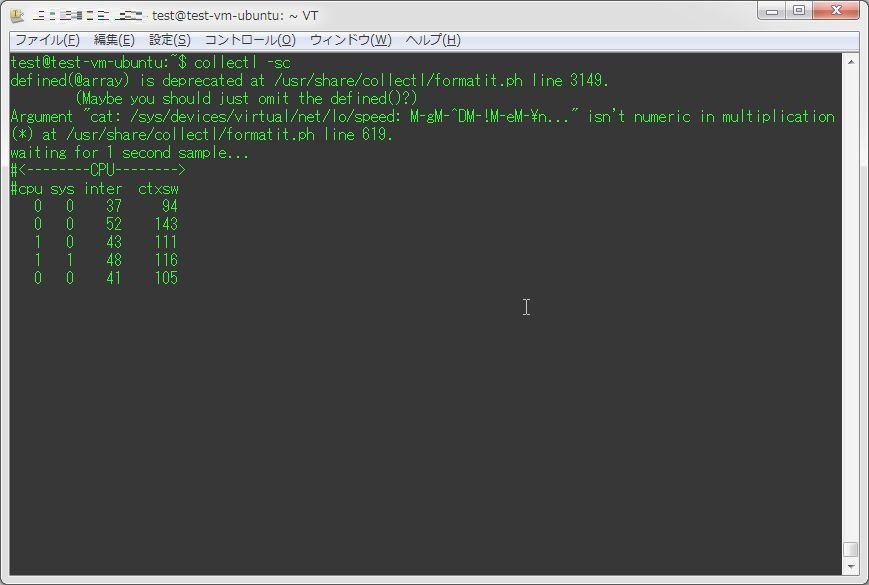
「-sC」の方が、より詳細な内容を取得出来る。
collectl -sC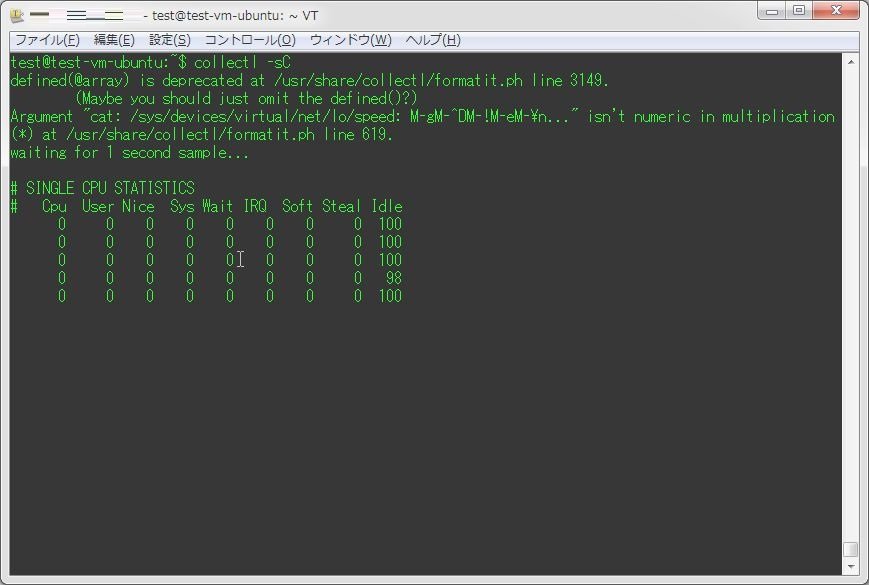
メモリの値をモニタリングする
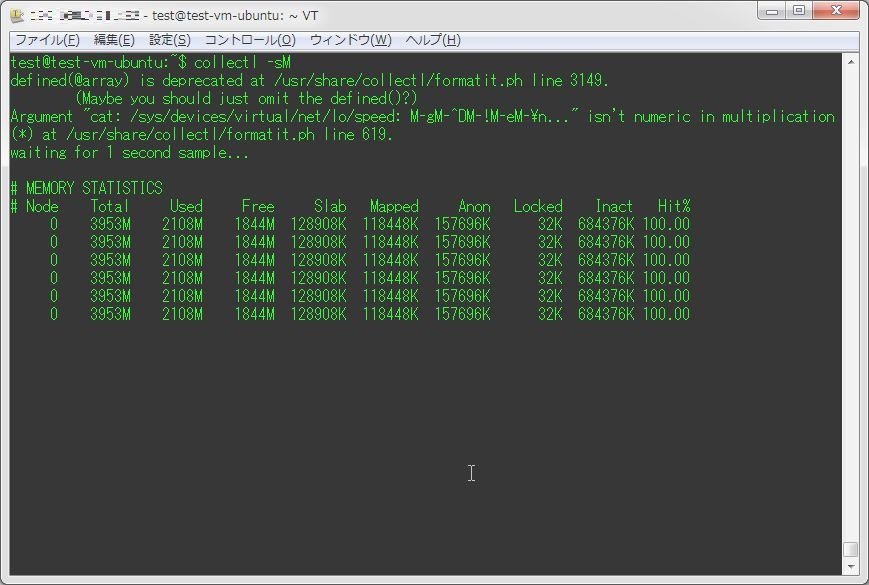
メモリの値は、オプション「-sm」もしくは「-sM」を用いる事で取得出来る。
collectl -sm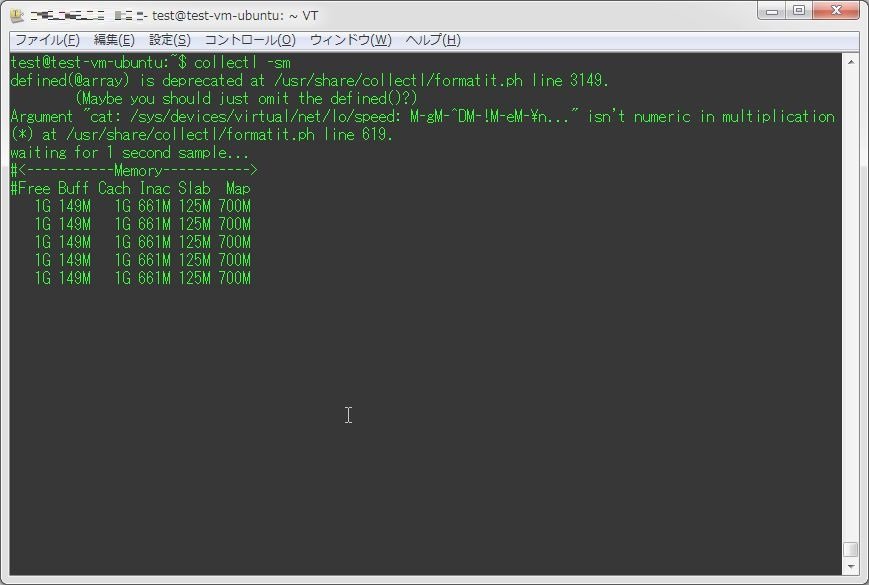
こちらも、「-sM」の方が詳細な内容を取得出来る。
ディスクの値をモニタリングする
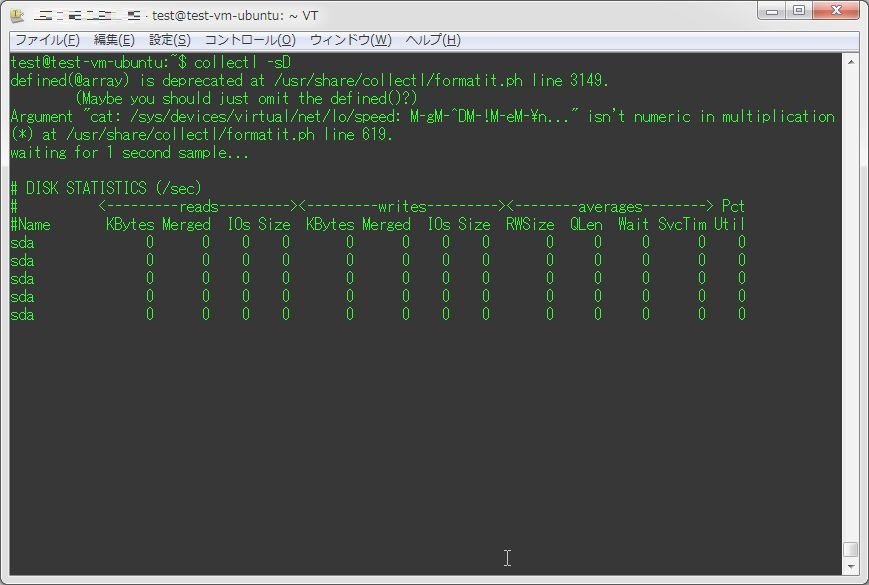
ディスクの値は、オプション「-sd」もしくは「-sD」を用いる事で取得出来る。
collectl -sd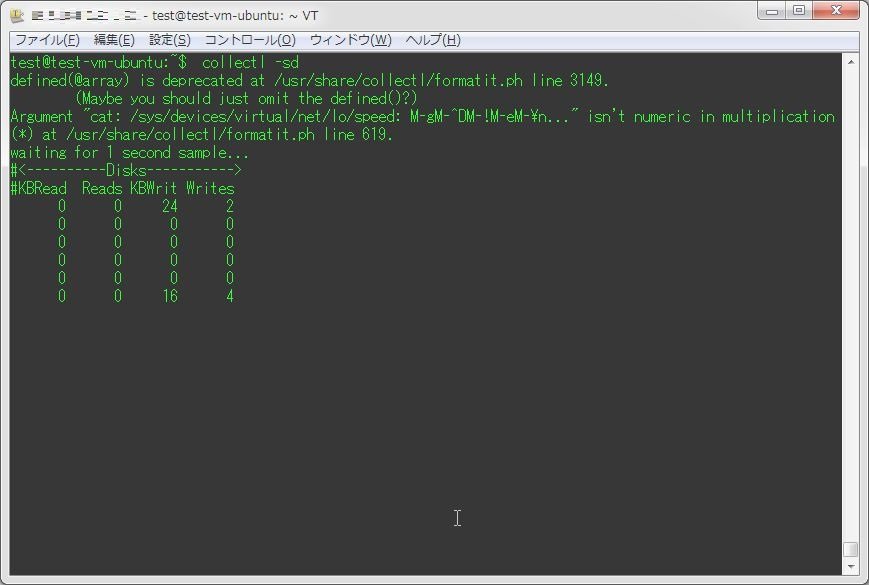
むろん、こちらも「-sD」の方が詳細な内容を取得出来る。
時刻を表示させる
時刻をパラメータ値の左側に表示させるには、「-oT」オプションを用いる。
collectl -oT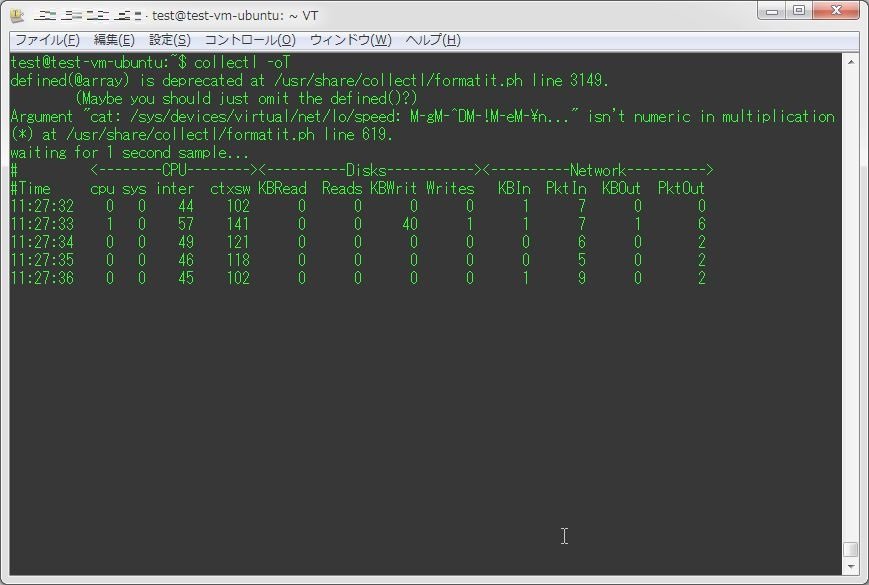
他のコマンド風にモニタリングを行う
『Collectl』では、オプションで他のコマンド(iotopなど)のように表示を行わせる事が出来る。
まずはiotop風に表示させる。
collectl --top iokb,10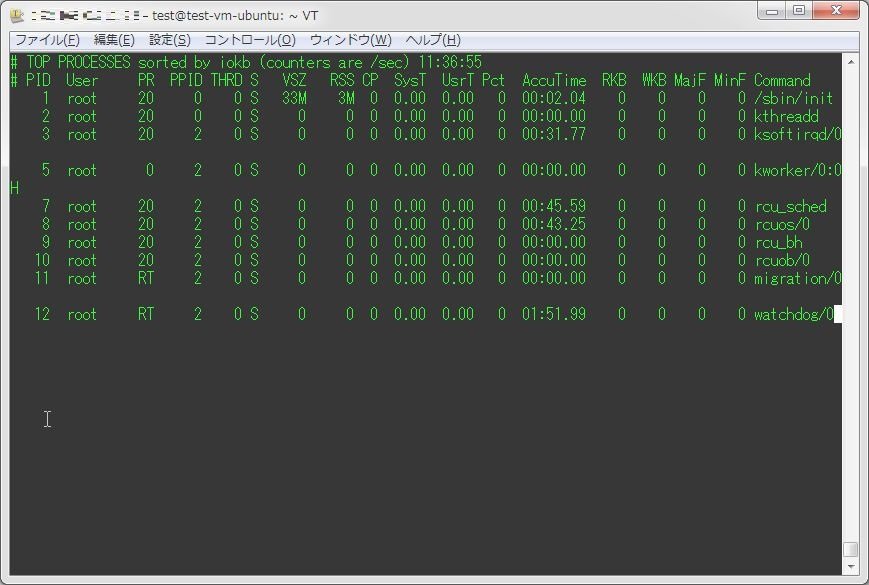
次はtop風に表示させる。
collectl --top -scm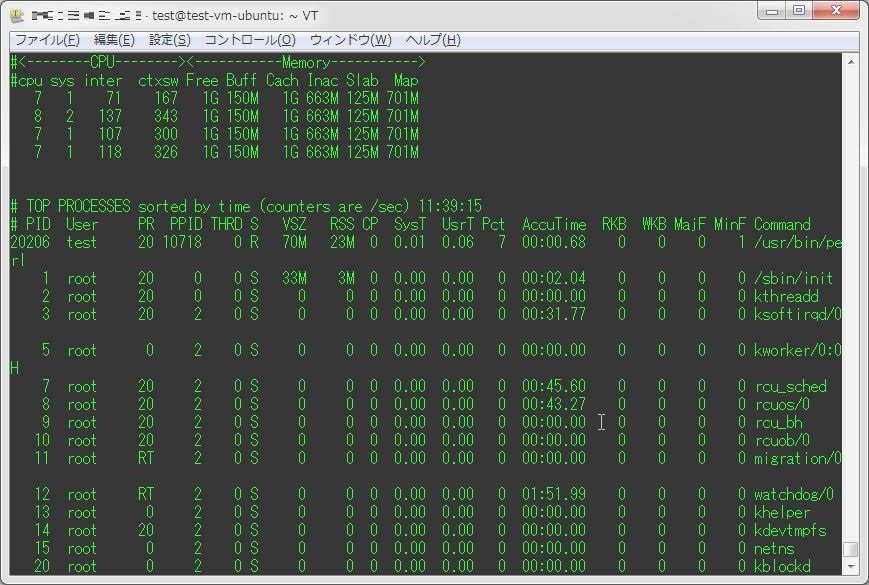
次はvmstat風に表示させる。
collectl --vmstat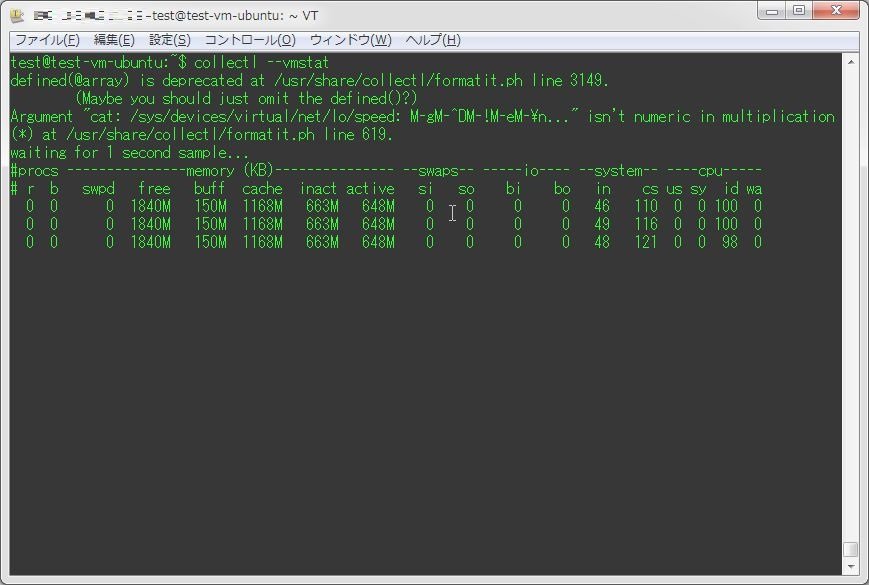
こんなところだろうか。色々な表示のさせ方があり、ちょっとおもしろい。